Rabu, 30 Desember 2020

Compound (COMP) Outruns Top DeFi Tokens as TVL Closes Above $2B

Compound Finance’s native token COMP was among the biggest gainers in the decentralized finance space on Wednesday.

The fourth-largest DeFi token by market cap surged by more than 10 percent, hitting an intraday high of $154.08 as traders assessed a flurry of upside fundamentals around it. A pseudonymous analyst noted that the Compound protocol lured traders with competitive annual percentage yields on its staking platform. That allowed its liquidity pool to attract about $820 million worth of tokens in just five hours.

“Wonder if longing the bluechip with the highest APY when staked in a pool of a protocol that has amassed ~820m TVL in 5hrs is a reasonable strategy,” the analyst tweeted, followed by the word “COMP.”

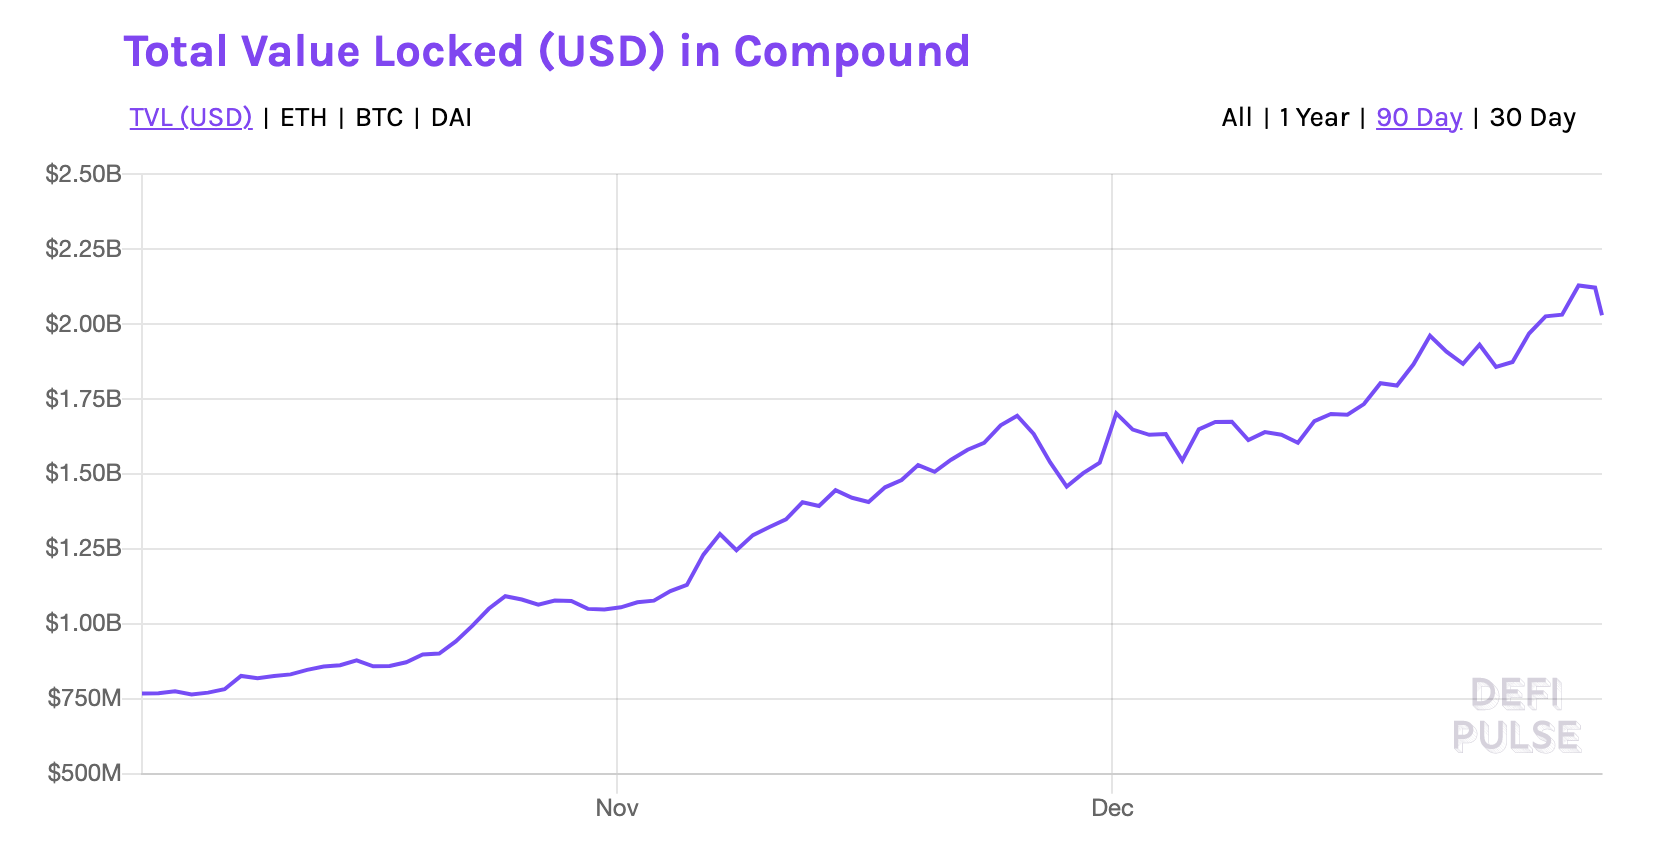
The total value locked inside the Compound smart contracts surpassed $2 billion following the capital inflow. It corrected lower on Wednesday, but traders largely ignored the downside move.
DeFi, decentralized finance, Bitcoin, Compound, Ethereum
Compound Total Value Locked sustains above $2 billion. Source: DeFi Pulse

That may have to do with the Compound’s whitepaper released last week wherein it shared the details of its new blockchain: the Compound Chain. The paper projected it as a protocol-independent ledger that would store and transfer crypto assets between multiple blockchains.

A Break from Ethereum

Compound currently uses Ethereum as its principal blockchain. Therefore, its lending protocol cannot offer support to non-Ethereum assets. Compound Chain strives to fill the shortcomings, thereby enabling its protocol to facilitate direct liquidity across “peer chains.” They include ETH 2.0, Polkadot, Solana, Quorum, Celo, and many others.

The Compound Chain will also introduce a native stablecoin CASH to pay block validators. COMP will continue to serve as a governance token, providing its holders the right to propose and vote for changes in the core Compound protocol.

The feature expects to come out in the first quarter of 2021.

COMP At Risk, Nevertheless

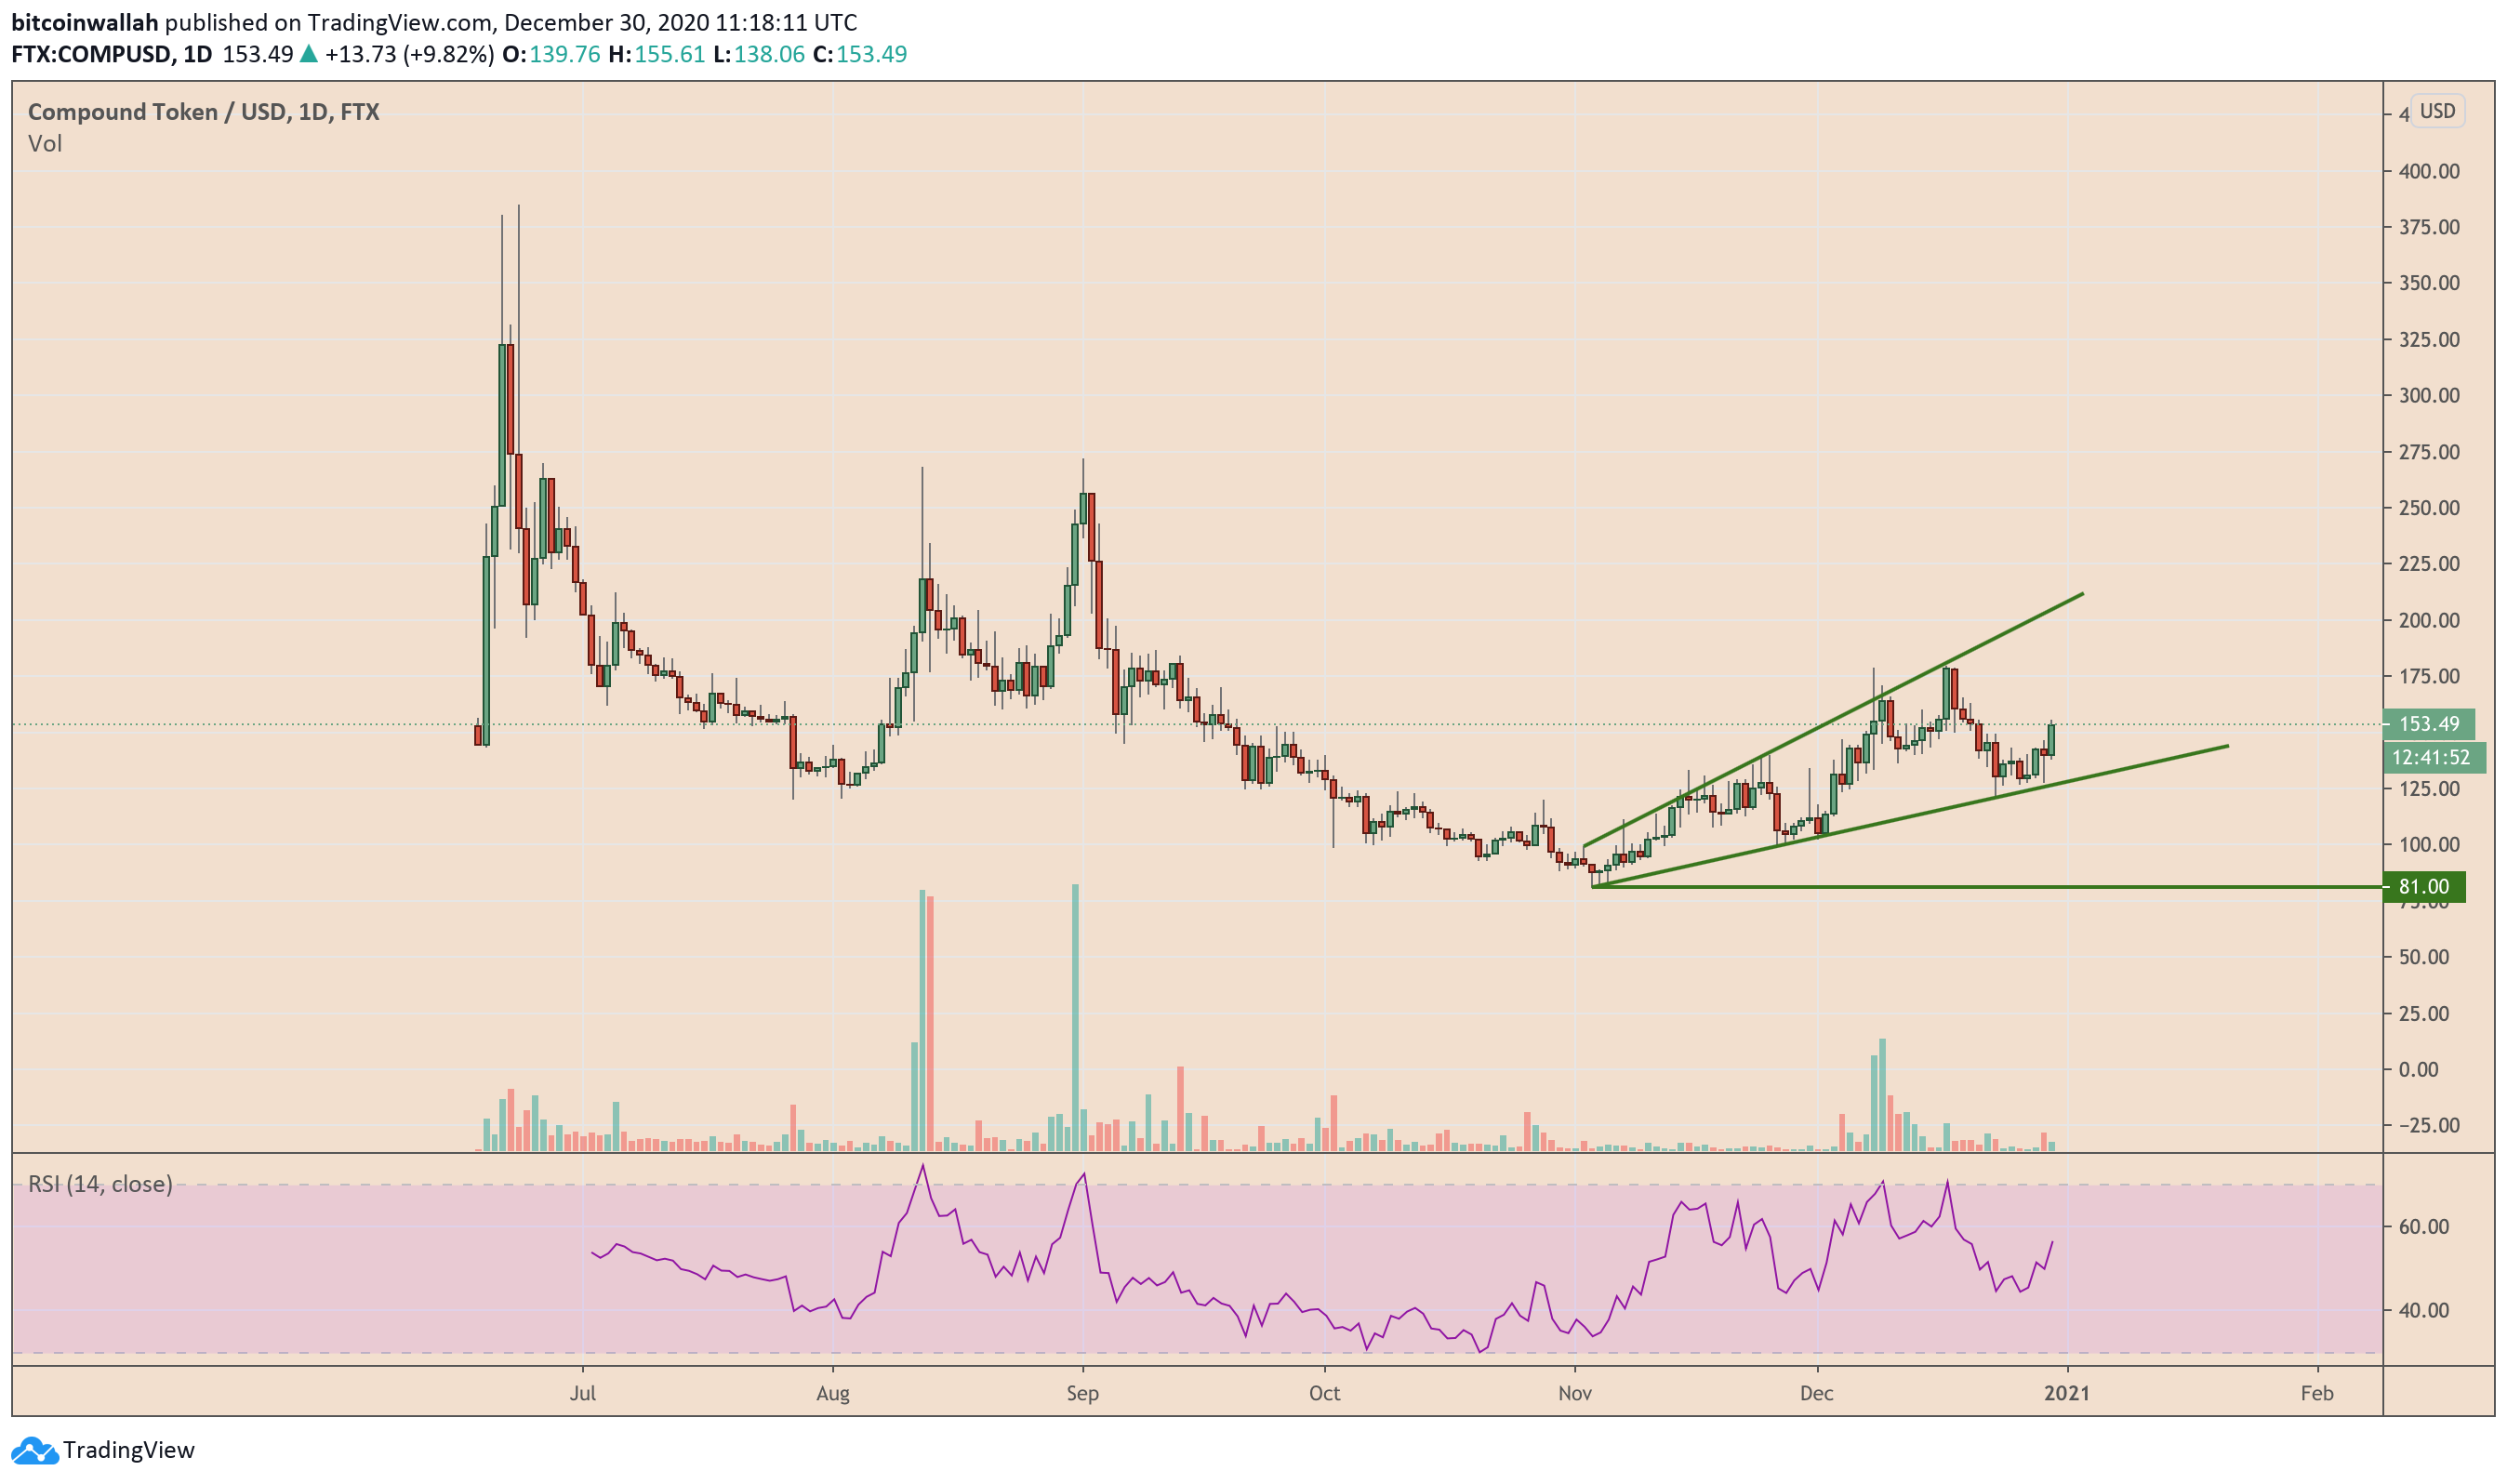
The latest COMP price rally, meanwhile, came with its own set of bearish foretellings. Technically, its December uptrend drew what analysts call an “Ascending Broadening Wedge.”

The pattern forms when an asset trends inside an area between two diverging trendlines, with the upper one acting as resistance and the lower one as support. COMP is fluctuating inside a similar structure since early November, as shown in the chart below.
DeFi, decentralized finance, Bitcoin, Compound, Ethereum, COMPUSD, COMPBTC
The Compound token is eyeing a bearish reversal. Source: COMPUSD on TradingView.com

Ascending Broadening Wedges ends up turning assets lower 79 out of every 100 times, according to a study by Central Charts. Meanwhile, there is a 40 percent chance that the price may head towards the upper trendline for a pullback. That roughly puts COMP en route to a $200-valuation.

A breakdown below the Wedge could bring the price to as low as $81.


from NewsBTC https://ift.tt/2JxPWiE
Find The best Lending Program Top CryptocurrencyLending Program

TTM Bank Launches Global Crypto Card

Registered in Estonia, financial company TTM Bank has issued the Prepaid Crypto Card, which can be used to pay wherever VISA payment system cards are accepted.

TTM Bank Prepaid Crypto Card supports four cryptocurrencies: BTC, ETH, USDT, and TRX. The card can be used for purchases in both offline and online stores. When depositing, cryptocurrencies credited to the card account are converted into euro at the internally generated rate of TTM Bank. The holders of the TTM Bank Crypto Card can withdraw fiat money from ATMs all over the world.

Users can order a stylish elegant black plastic card or its virtual version.

“The main advantage of cryptocurrencies is that the assets belong only to their owner. And we, in turn, have created a card that allows its holder not only to fully control their own funds, but also serves as a link between the digital market and the classical financial system. The TTM Bank card is replenished with cryptocurrency, which is instantly converted into euros when deposited, allowing holders to use the card for purchases in any stores, restaurants, hotels, and online shops. The TTM Bank card is not a cryptowallet for storing cryptocurrencies, but a convenient and reliable tool for everyday purchases, a long-desired product among cryptocurrency holders,” says the TTM Bank co-founder Vladislav Utushkin.

More than 40,000 people have already started to actively use TTM Bank cards.

The card is a product of the virtual bank TTM Bank, which is the trade name of btc2wire company registered in Estonia. Distribution, delivery and management of card accounts is carried out by the company’s partner, financial services operator UAB Walletto, registered in Lithuania and a member of the VISA payment network. Deposited funds in fiat currency are stored in a licensed bank.

More information on the official TTM Bank’s webpage.


from NewsBTC https://ift.tt/3aSGi5j
Find The best Lending Program Top CryptocurrencyLending Program
Bitcoin Price Hits New All-Time High Above $28,500

Bitcoin has undergone a strong rally over the past 24 hours. The cryptocurrency is up 8% in the past 24 hours alone, pushing from the $27,000 range to $28,500 now.

The leading cryptocurrency set a new all-time high just a number of minutes ago above $28,500, pushing to $28,600 on top exchanges. This was marked by not much hype on Twitter despite this being a new all-time high, potentially because this new high was only marginally above the previous one. Also, Twitter seems to be focused on an Ethereum-based DeFi app as opposed to the Bitcoin rally.

Related Reading: Here’s Why Ethereum’s DeFi Market May Be Near A Bottom

Bitcoin Explodes Higher

This comes as there has been a continued interest by institutions in BTC.

Skybridge Capital was revealed today to have likely invested over $180 million worth of capital into Bitcoin via its funds. The company recently launched a Bitcoin-focused fund to allow investment advisors to gain exposure to the leading cryptocurrency.

Raoul Pal thinks that reflexivity will take this market to an extremely volatile place.

Related Reading: 3 Bitcoin On-Chain Trends Show a Macro Bull Market Is Brewing
Featured Image from Shutterstock
Price tags: xbtusd, btcusd, btcusdt
Charts from TradingView.com
Bitcoin Hits New All-Time High Above $28,500


from NewsBTC https://ift.tt/38RGEXw
Find The best Lending Program Top CryptocurrencyLending Program
Selasa, 29 Desember 2020

Charted: Polkadot (DOT) Surges 15%, Why Rally Isn’t Over Yet

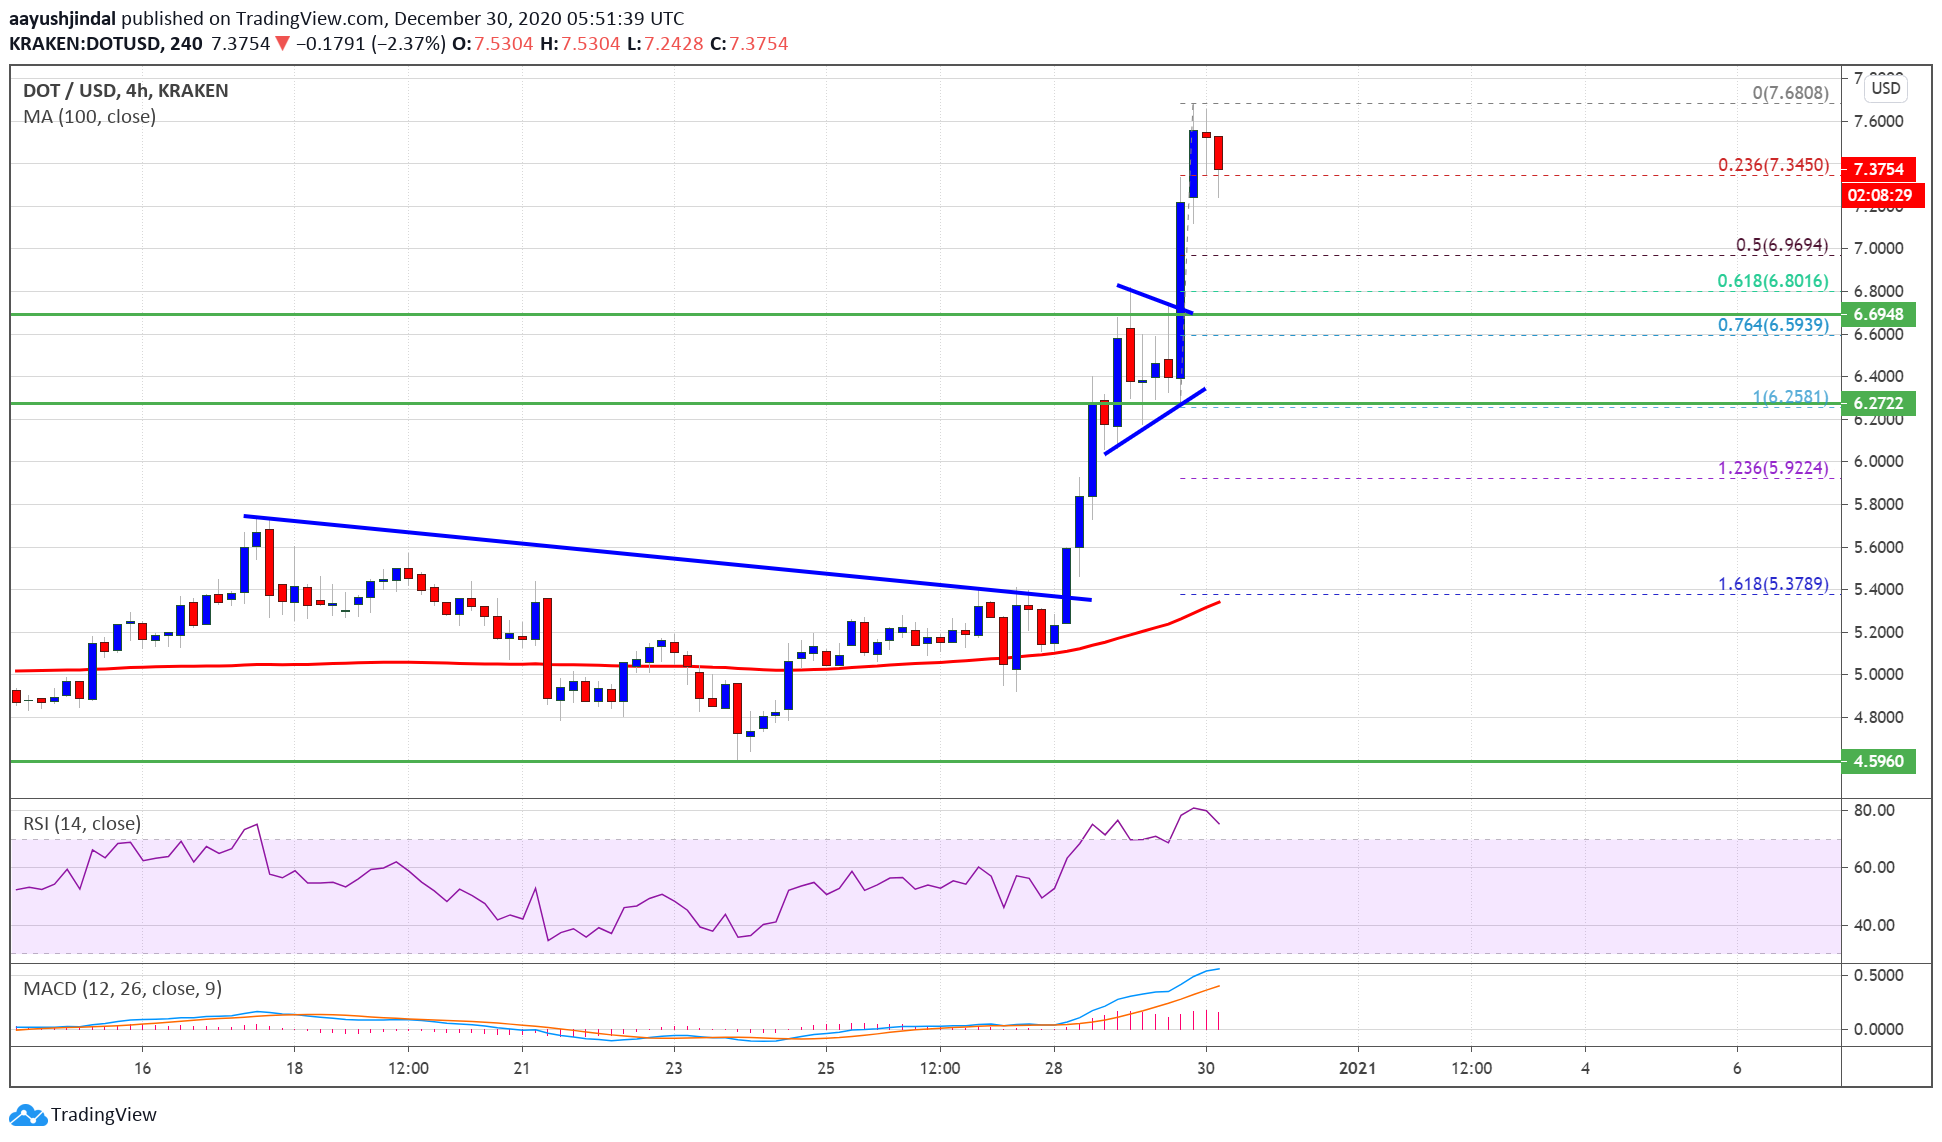
Polkadot’s DOT started a strong surge after it broke the $5.40 resistance against the US Dollar. It is up over 20% this week, and it even rallied above $7.00.

  • DOT gained pace above the $5.40 and $6.00 levels to start a fresh increase against the US dollar.
  • The price is now trading well above $7.00 and the 100 simple moving average (4-hours).
  • There was a break above a major bearish trend line with resistance near $5.40 on the 4-hours chart of the DOT/USD pair (data source from Kraken).
  • The pair traded as high as $7.68 and it is currently correcting lower.

Polkadot’s DOT Rallies Significantly

This week, DOT formed a strong support base above the $5.00 level. It started a steady increase and broke a couple of important hurdles near $5.40 to move into a bullish zone.

It even settled above the $5.50 level and 100 simple moving average (4-hours). More importantly, there was a break above a major bearish trend line with resistance near $5.40 on the 4-hours chart of the DOT/USD pair.

There was a sharp upward move above the $6.00 and $7.00 levels. The price traded to a new monthly high above $7.50 at $7.68, and it outperformed bitcoin and ETH. It is currently correcting lower and trading below $7.50. It already tested the 23.6% Fib retracement level of the recent increase from the $6.25 swing low to $7.68 high.

Polkadot (DOT)

The first major support on the downside is near the $7.00 zone. It is also close to the 50% Fib retracement level of the recent increase from the $6.25 swing low to $7.68 high.

On the upside, the $7.50 and $7.65 levels are important hurdles. A clear break above the $7.65 level could open the doors for a steady increase in the coming days towards $8.00 or $8.20.

Dips Supported?

If DOT price starts a downside correction below $7.20, it could find a strong buying interest near the $7.00 and $6.95 levels in the near term.

The next major support is near the $6.70 level (a multi-touch zone) and the recent breakout zone. Any more losses might call for a test of the $6.25 support zone.

Technical Indicators

4-Hours MACD – The MACD for DOT/USD is gaining momentum in the bullish zone.

4-Hours RSI (Relative Strength Index) – The RSI for DOT/USD is now well above the 60 level.

Major Support Levels – $7.20, $7.00 and $6.95.

Major Resistance Levels – $7.50, $7.65 and $8.00.


from NewsBTC https://ift.tt/383iCJX
Find The best Lending Program Top CryptocurrencyLending Program

TA: Why Ethereum Could Rally Above $750, Key Uptrend Support Intact

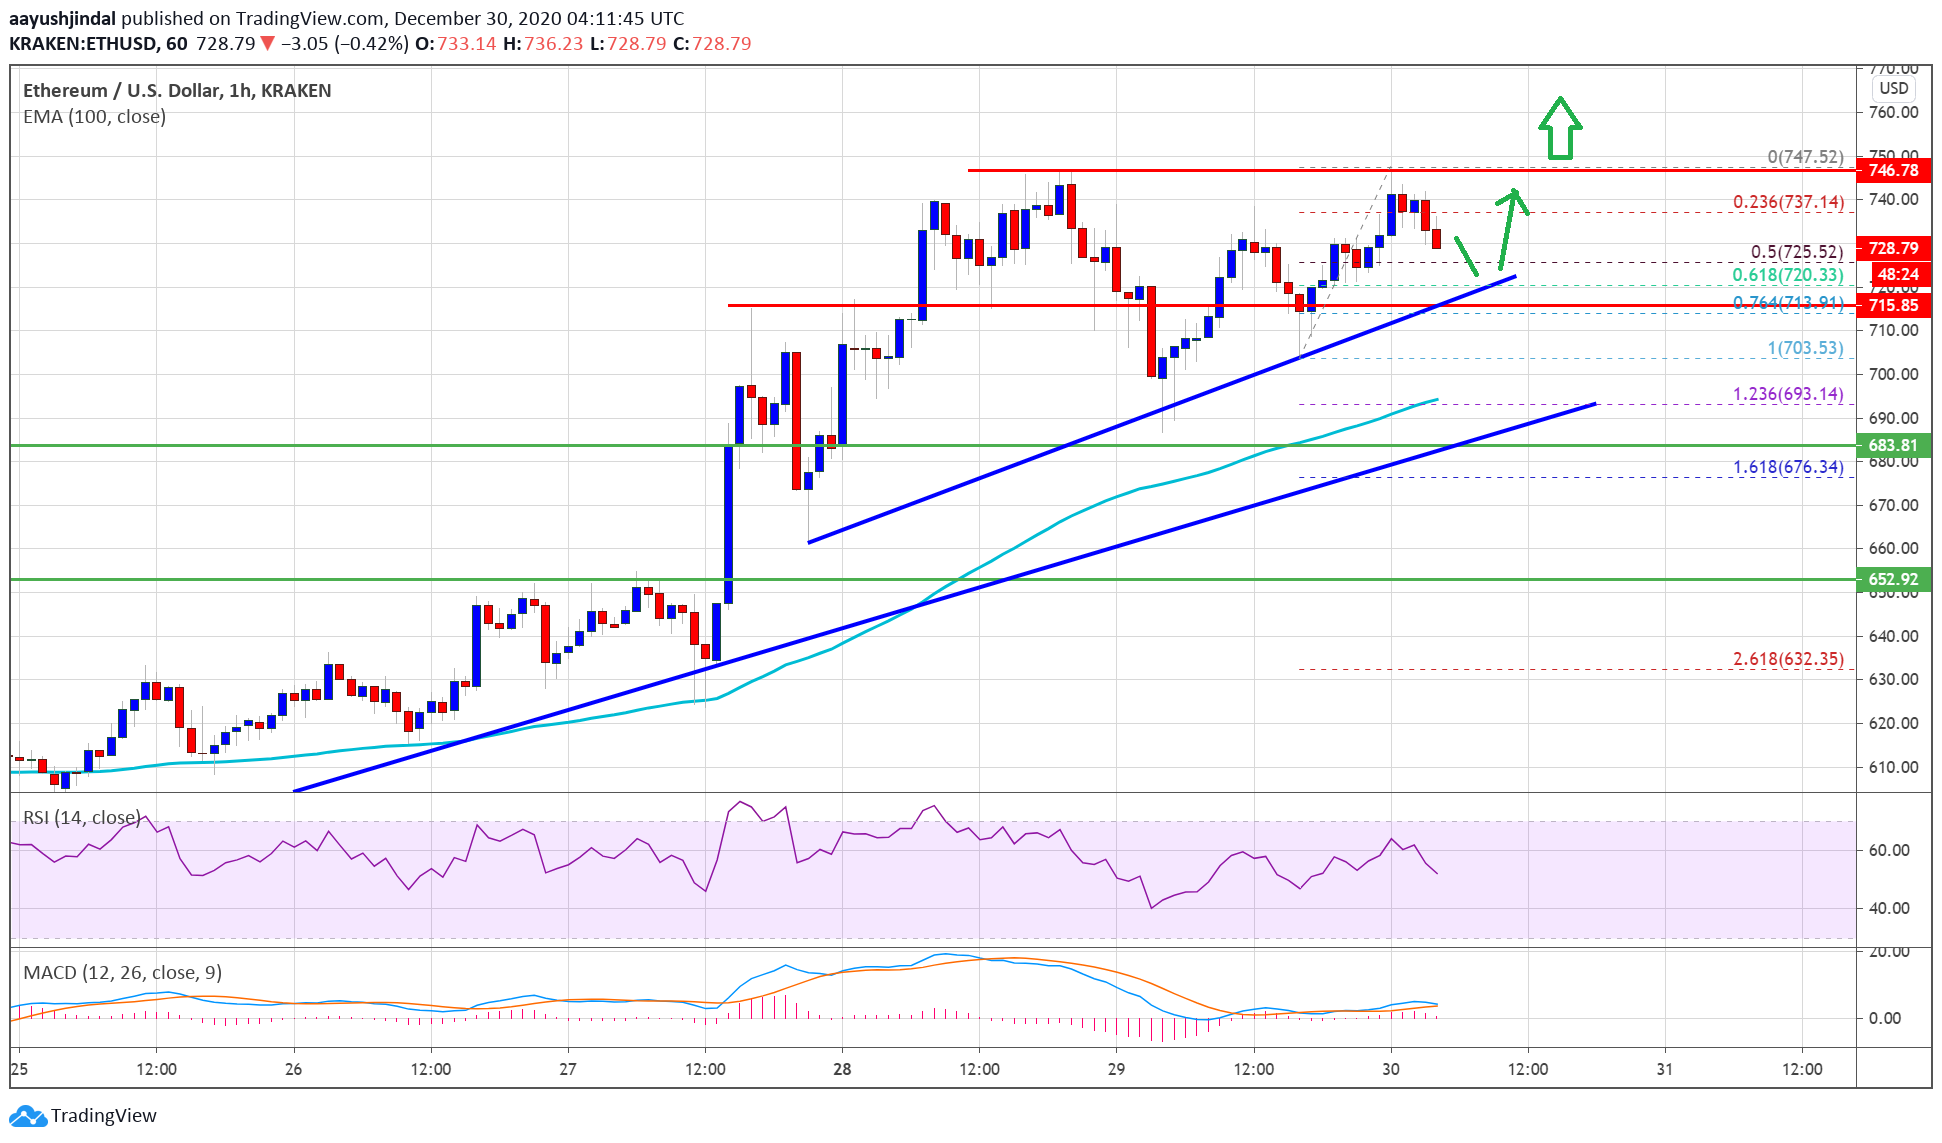
Ethereum started a fresh increase from the $700 zone against the US Dollar. ETH price retested the $745 resistance and it is likely to attempt an upside break above $750.

  • Ethereum remained well bid above $695 and it climbed back above $720.
  • The price is now trading well above $720 and the 100 hourly simple moving average.
  • There is a key bullish trend line forming with support near $720 on the hourly chart of ETH/USD (data feed via Kraken).
  • The pair is likely to continue higher above the $745 and $750 resistance levels in the near term.

Ethereum Price is Gaining Momentum

There was a minor downside correction in Ethereum below the $720 support level. However, dips were limited below the $700 level. ETH price remained well bid above $695 and the 100 hourly simple moving average.

A swing low was formed near $693 before the price climbed back above $720. The last swing low was near $703 before the main upward move above the $730 level. The price even broke the $740 level, but it struggled to clear the $745 resistance level.

A high was formed near $747 and the price is currently correcting lower. It broke the $735 level. There was also a break below the 23.6% Fib retracement level of the recent rise from the $703 swing low to $747 high.

Ethereum Price

The first major support is near the $725 level. There is also a key bullish trend line forming with support near $720 on the hourly chart of ETH/USD. The trend line coincides with the 50% Fib retracement level of the recent rise from the $703 swing low to $747 high.

On the upside, the $740 and $745 levels are important hurdles. Once there is a close above the $750 level, ether price is likely to accelerate higher. The next major resistance on the upside might be $780. Any further gains could lead the price towards the $800 level.

Dips Supported in ETH?

If ethereum fails to clear the $745 hurdle, it could correct lower. An initial support on the downside is near the $725 pivot level, followed by $720.

A downside break below the trend line support could lead ether price towards the $700 support zone and the 100 hourly SMA in the near term.

Technical Indicators

Hourly MACD The MACD for ETH/USD is showing positive signs in the bullish zone.

Hourly RSI The RSI for ETH/USD is currently sliding towards the 50 level.

Major Support Level – $720

Major Resistance Level – $745


from NewsBTC https://ift.tt/3aUdZTZ
Find The best Lending Program Top CryptocurrencyLending Program

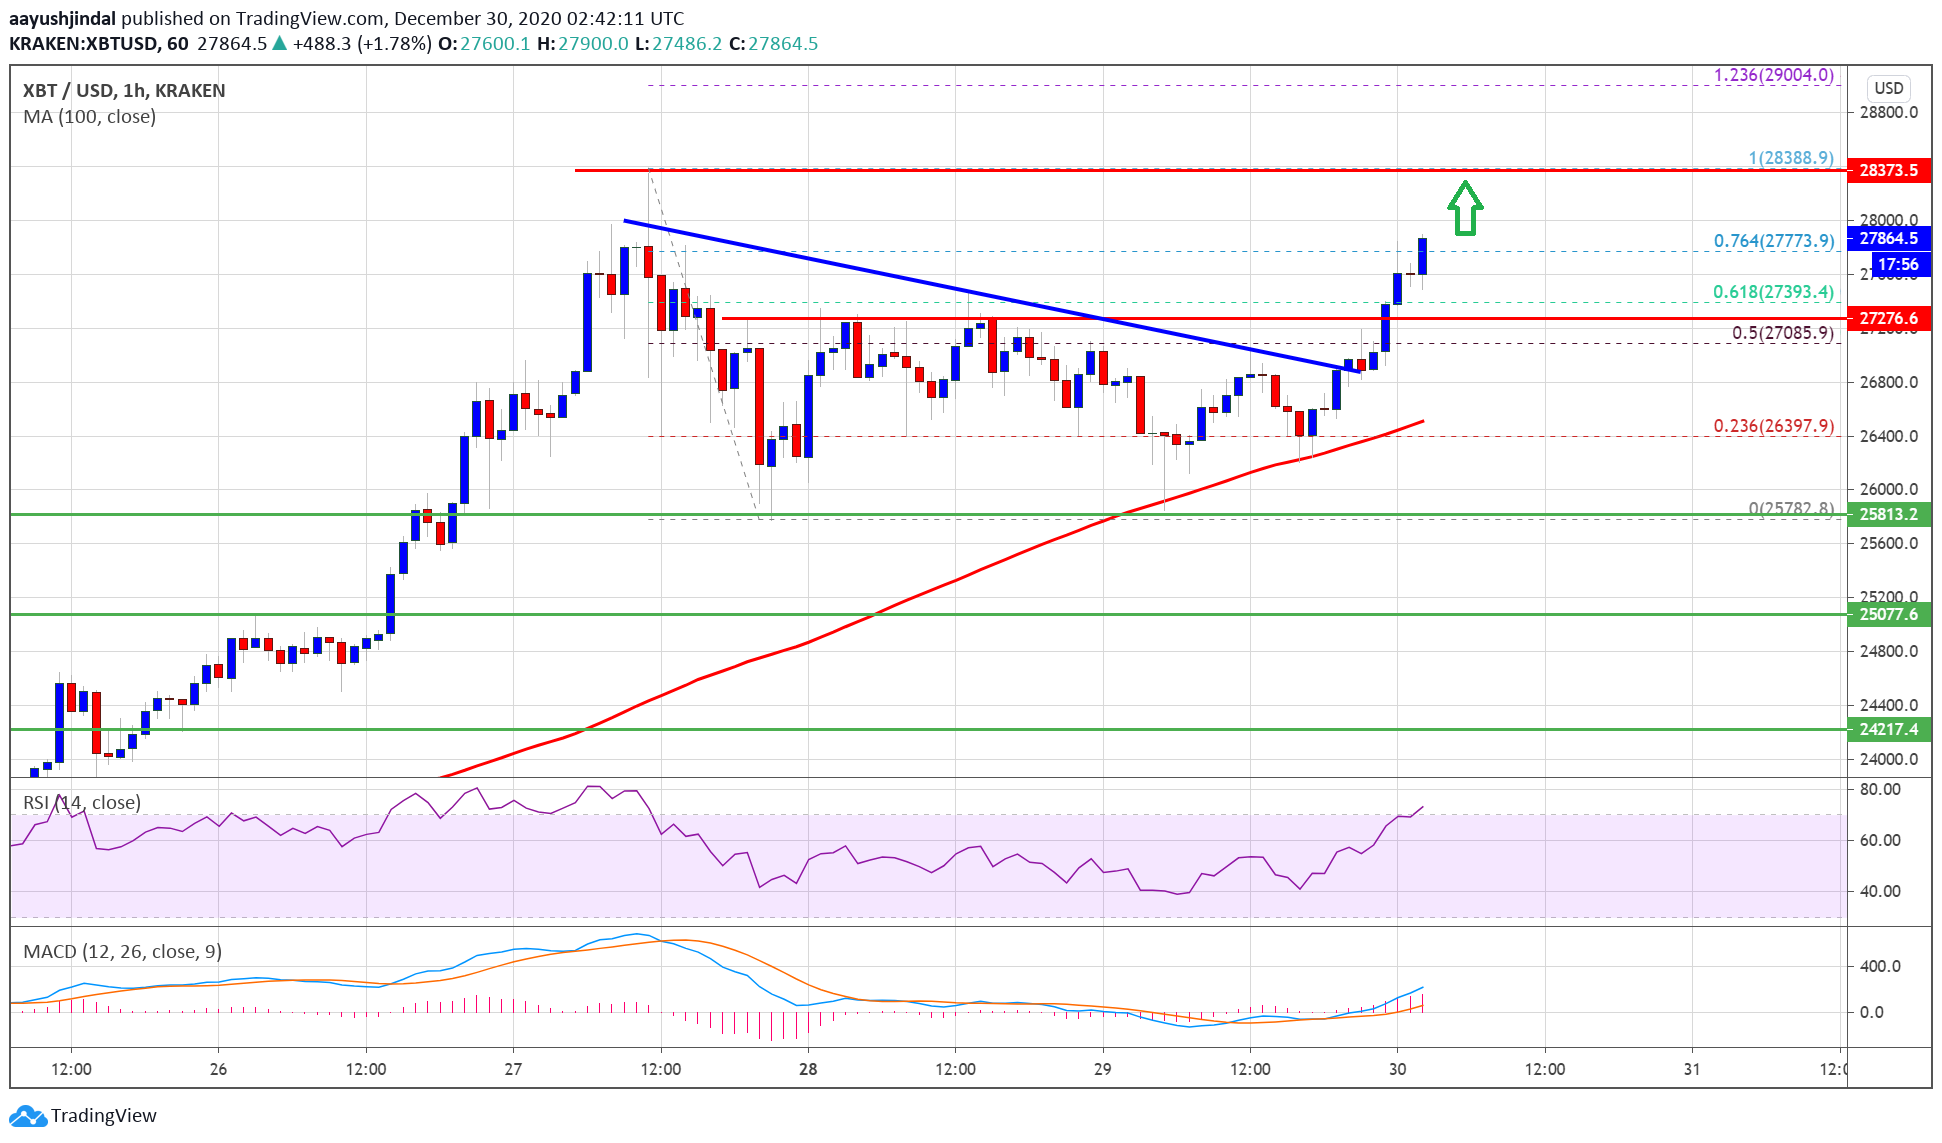
TA: Bitcoin Price Regains Strength, Why BTC Could Surge To $30K

Bitcoin price formed a strong support base above $26,000 and started a fresh increase against the US Dollar. BTC is gaining momentum and it is likely to break $28,000 and $28,400.

  • Bitcoin is showing a lot of positive signs above the $27,000 and $27,300 resistance levels.
  • The price is currently trading above the $27,500 support and the 100 hourly simple moving average.
  • There was a break above a major bearish trend line with resistance near $26,800 on the hourly chart of the BTC/USD pair (data feed from Kraken).
  • The pair is likely to continue higher above $28,000 in the coming sessions.

Bitcoin Price Breaks $27,300

After a short-term downside correction, bitcoin price found support near the $26,000 zone. BTC likely formed a double bottom pattern near $25,800 and started a fresh increase.

It broke many hurdles near $26,400 and $27,000 to move into a positive zone. There was a clear break above the key $27,300 resistance zone and the price settled above the 100 hourly simple moving average. There was also a break above a major bearish trend line with resistance near $26,800 on the hourly chart of the BTC/USD pair.

Bitcoin price even cleared the 61.8% Fib retracement level of the downside correction from the $28,389 swing high to $25,782 low. It is showing a lot of positive signs above the $27,300 and $27,500 levels.

Bitcoin Price

Source: BTCUSD on TradingView.com

The price is rising and trading just above the 76.4% Fib retracement level of the downside correction from the $28,389 swing high to $25,782 low. It seems like there are chances of a sustained upward move above the $28,000 resistance zone.

Any more upsides might clear the path for a fresh all-time high above the $28,400 level. In the stated case, the price could even rally towards the $30,000 level.

Dips Supported in BTC?

If bitcoin starts another downside correction, it is likely to find support near the $27,300 zone (the recent breakout zone) or the $27,200 level.

The next major support is near the $26,500 level and the 100 hourly SMA. Any more losses could lead the price back towards the key $26,000 support zone in the coming sessions.

Technical indicators:

Hourly MACD – The MACD is gaining momentum in the bullish zone.

Hourly RSI (Relative Strength Index) – The RSI for BTC/USD is currently well above the 50 level.

Major Support Levels – $27,300, followed by $27,000.

Major Resistance Levels – $28,000, $28,400 and $29,200.


from NewsBTC https://ift.tt/2WTnlaH
Find The best Lending Program Top CryptocurrencyLending Program

Bitcoin Dominance Doji: Why 2021 Could Spell Doom For Altcoins

Bitcoin has been explosive all of 2020, and while certain altcoins like Ethereum and a slew of DeFi tokens have outperformed the top cryptocurrency this year, altcoins overall have been a disappointment compared to past cycles.

Those who lived through past cycles, expected altcoins to take off the moment Bitcoin surpassed its previous peak. But that moment has come and gone, and while there have been some glimmers of positive momentum, the asset class as a whole is lagging behind BTC. This is reflected in BTC dominance, which could close 2020 with a dangerous-looking doji candle, signaling “indecision” and potential doom for altcoins in 2021.

Crypto Market Indecision: Bitcoin Dominance To Close 2020 With A Doji Candle

From the cryptocurrency bear market bottom to current prices, altcoins have been left in Bitcoin’s dust. The leading cryptocurrency by market cap has led the bullish charge, and already is trading almost $10,000 above its former all-time high.

But altcoins are nowhere in sight, and not even in the rearview of Bitcoin at this point. The divergence in capital flowing between the two types of crypto assets has caused BTC dominance – a metric measuring the top crypto asset against other altcoins by market cap – to soar to 70%.

Related Reading | Ripple Lawsuit Triggers XRP Led Altcoin Apocalypse

70% dominance is roughly where dominance started the year, despite the rollercoaster ride of a year that was 2020. Because the distance between the yearly open and close could be so narrow, there’s a risk of the annual candle closing as a doji.

btc dominance bitcoin altcoins

A red doji could be left behind on the 2020 BTC dominance chart | Source: CRYPTOCAP-BTC.D on TradingView.com

Doji are dangerous because they signal indecision and make choosing a direction less clear. They form at the top of trends when they are reversing or just before continuation when a market takes a breather.

The six-month candle pictured below shows that 70% dominance has acted as a strong resistance level in the past, and why it is currently presenting such a challenge to break. It could also act as a point where dominance turns around, Bitcoin bleeds or stagnates, and altcoins rocket off into the sunset.

Unfortunately, there are other factors both technical and fundamental that suggest this won’t happen in 2021.

btc dominance bitcoin altcoins

Six-month resistance could soon be flipped to support | Source: CRYPTOCAP-BTC.D on TradingView.com

The Technical And Fundamental Reasons For The Coming Altcoin Apocalypse

Zooming out further to quarterly candles below, the 70% level looks ready to break. A close above the resistance level would lead to a strong push higher, taking BTC dominance to the 80 and 90% range.

The idea might sound unreasonable with all of the projects in the crypto market compared to Bitcoin, but the sentiment surrounding altcoins keeps getting worse.

btc dominance bitcoin altcoins

Quarterly charts suggest that resistance at 70% dominance will soon break | Source: CRYPTOCAP-BTC.D on TradingView.com

Altcoins haven’t recovered nearly as much as Bitcoin, and might not ever. The assets aren’t an “institutional product” according to some investors, and institutions thus far have mostly been focused on BTC.

Few have lived up to any of the promises made three years ago, while Bitcoin has taken on an entirely new narrative that has caught on in a major way. Failure to produce any sort of FOMO like the last alt season, even after BTC taking out its all-time high, has holders questioning their position.

ascending triangle

Is an ascending triangle on BTC.D about to annihilate altcoins? | Source: CRYPTOCAP-BTC.D on TradingView.com

And while that could change and traditional finance could also target DeFi tokens, the SEC’s recent attack on crypto by way of Ripple could be the fatal blow to altcoins that sends BTC dominance skyrocketing.

According to top industry analysts in the know, the SEC is “sniffing” around other altcoin projects and companies, and could continue to take shots at the industry throughout the new year.

Related Reading | Analyst: Post Bitcoin, Traditional Finance Will Flock To DeFi, Not Ethereum

The price action due to institutions being so bullish on Bitcoin compared to altcoins could be forming a massive, multi-year ascending triangle pattern on BTC dominance. And if this pattern triggers to the upside, altcoins are doomed in 2021.

Featured image from Deposit Photos, Charts from, TradingView.com


from NewsBTC https://ift.tt/3mYFM8f
Find The best Lending Program Top CryptocurrencyLending Program